Roof Zone Mapping for Fort Worth Commercial Buildings
Roofing Capabilities for Fort Worth buildings: roof zone mapping for fort worth commercial buildings is reviewed through roof condition, drainage, flashing, access, warranty status, and budget timing.
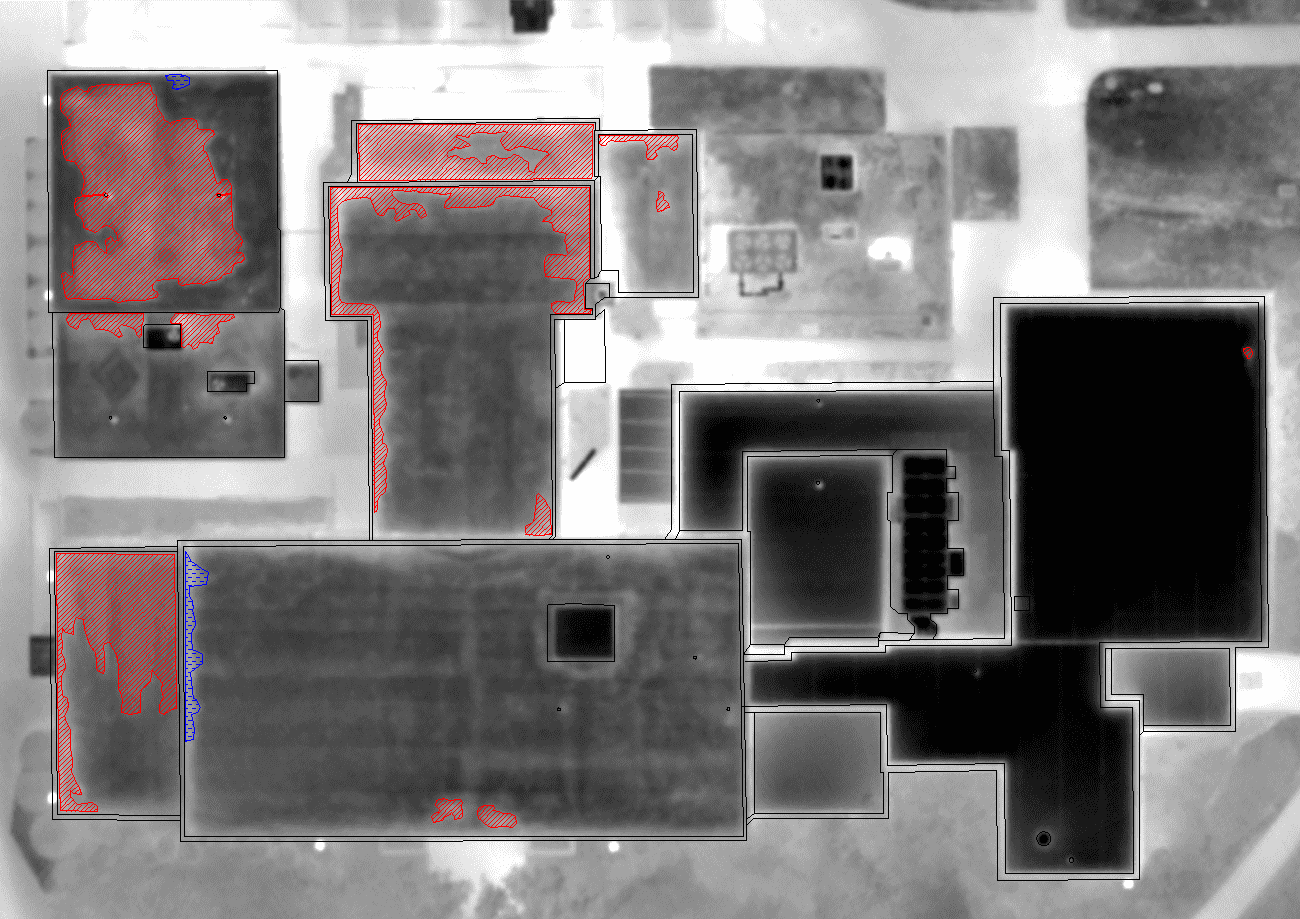
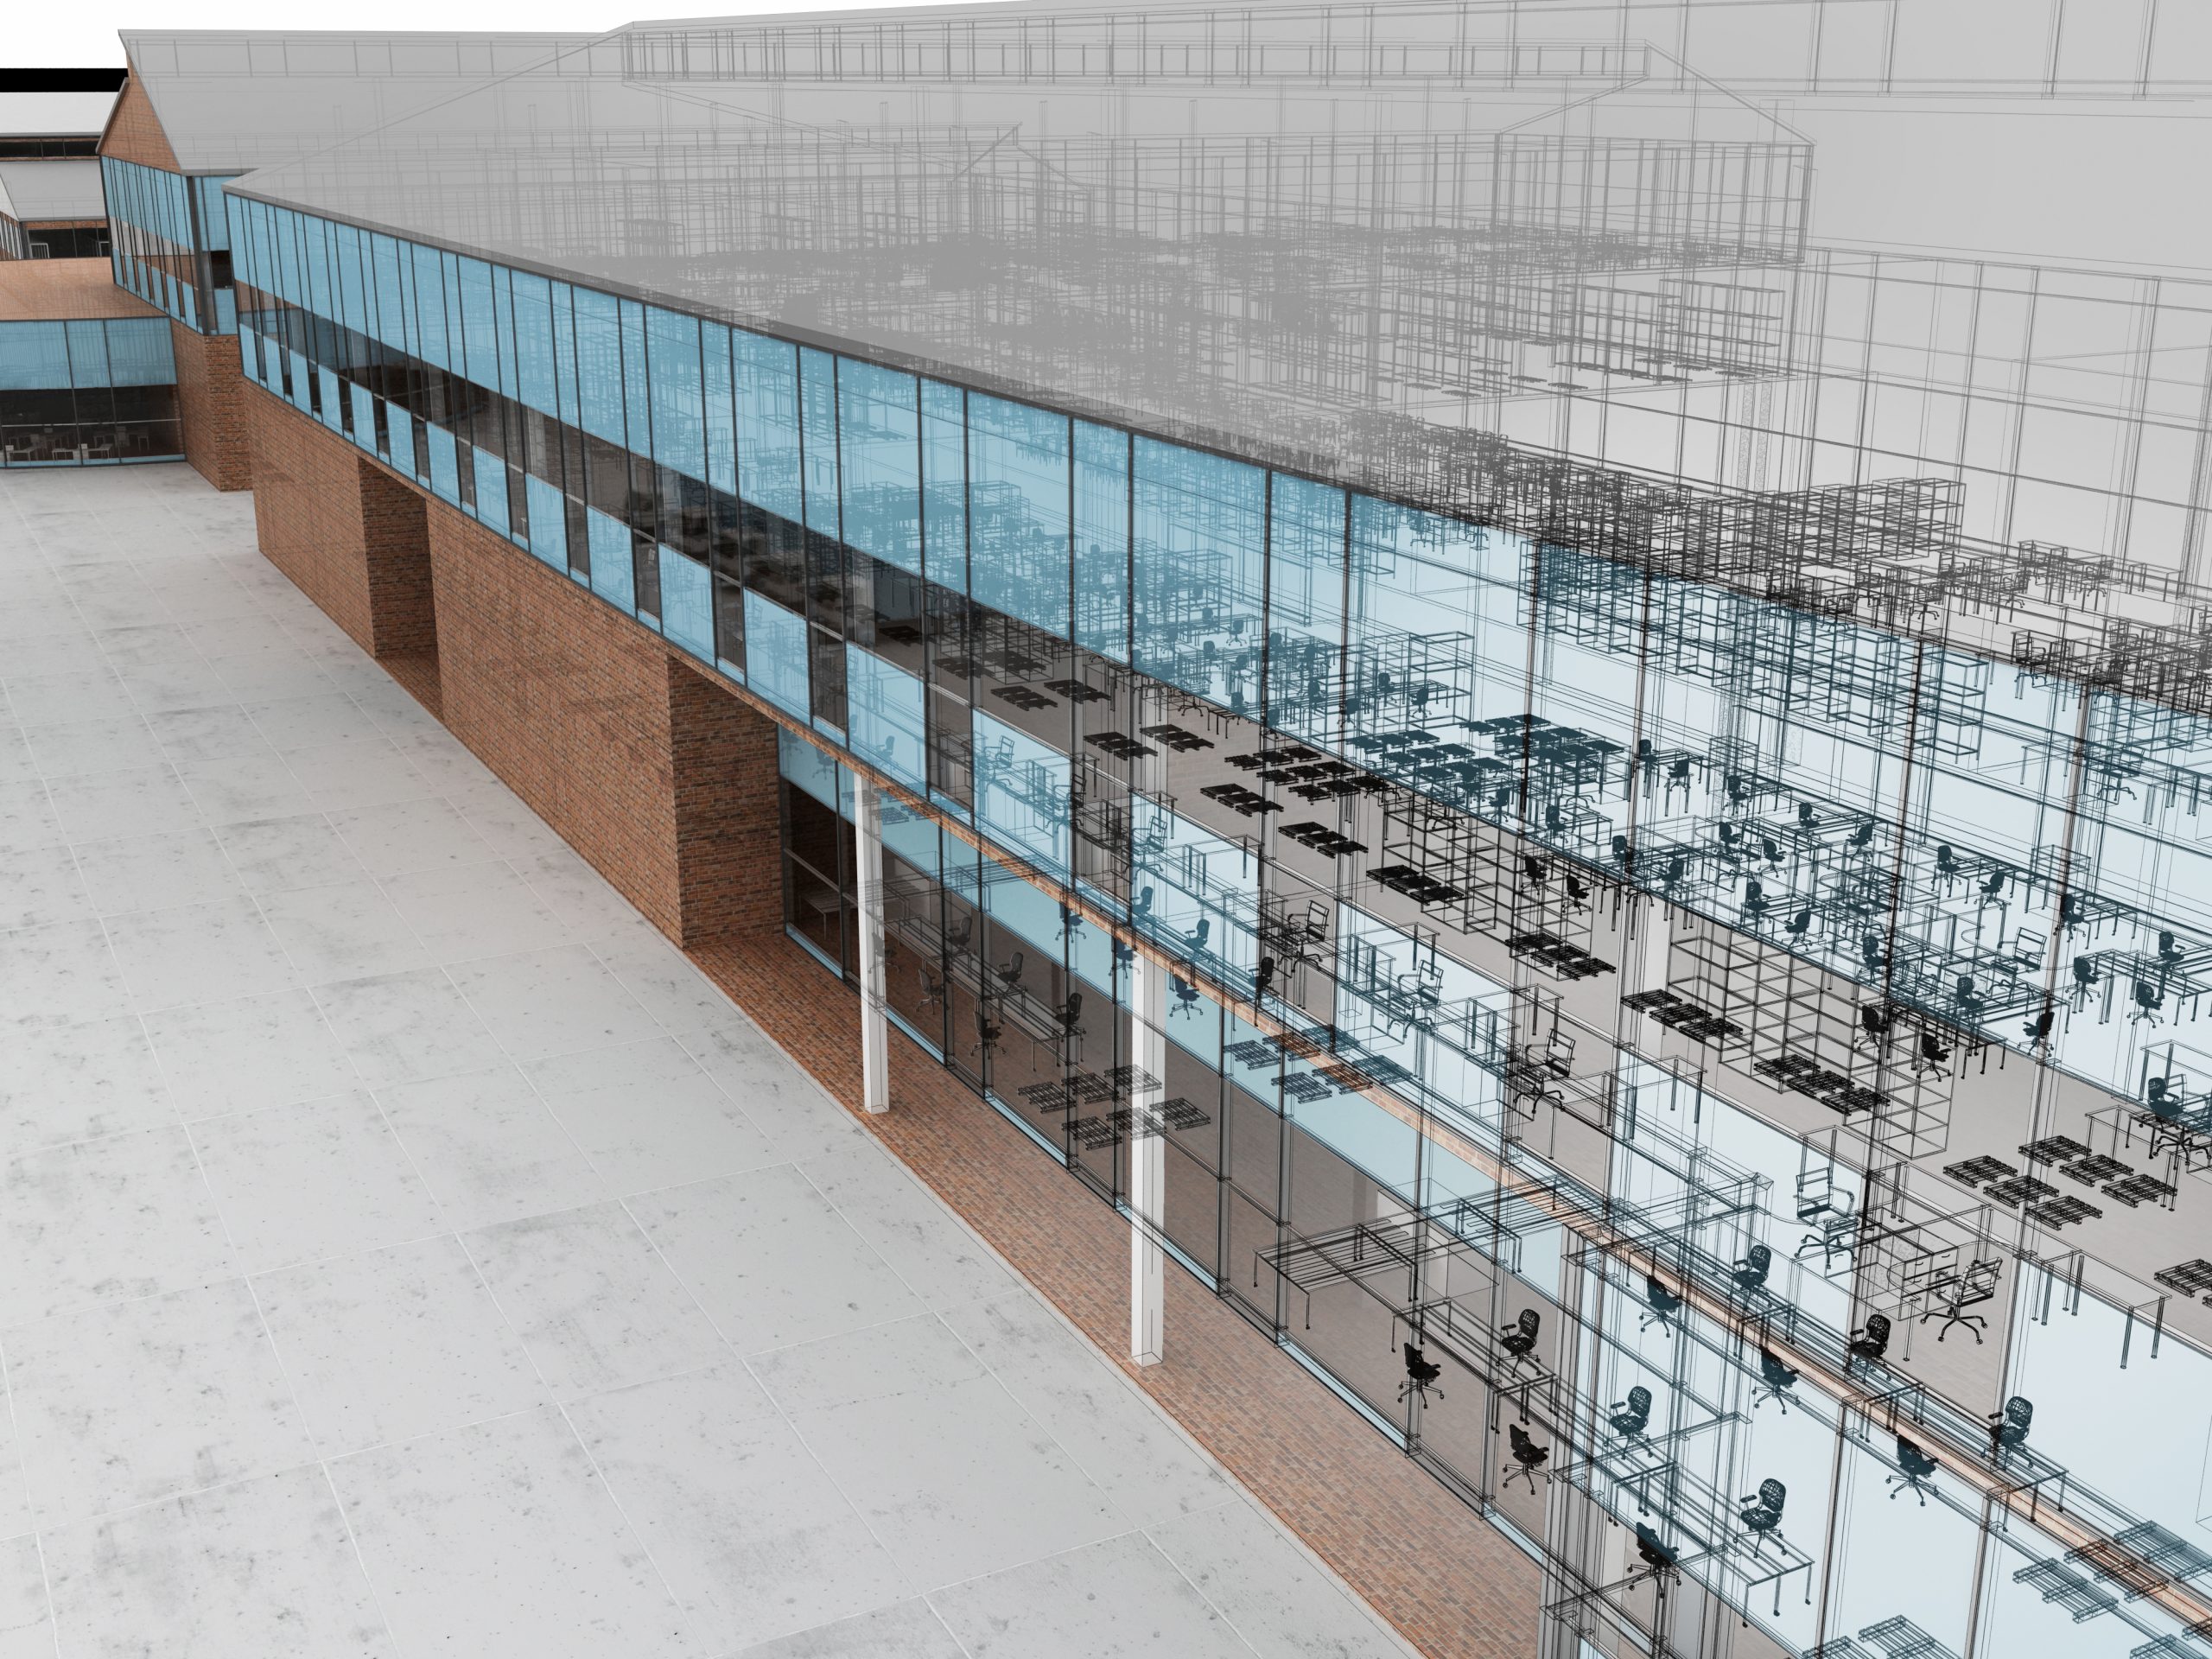
The zone diagram is the foundation of every report we produce. We draw it once, number the zones permanently, and use the same diagram year after year — so condition trend data actually means something when you look at it two or three inspections later.
A roof condition report that does not have a zone diagram is a list of observations without a map. You can read it, but you cannot navigate it. You cannot find the deficiency on the roof. You cannot compare this year's observation in a zone to last year's observation in the same zone, because 'the southeast corner' in one inspector's notes is not the same as 'the back-right quadrant' in another's. Zone mapping fixes that.
We draw zone diagrams from actual building measurements — not from satellite screenshots, which distort dimensions and lose precision at equipment clusters and parapet corners. The diagram is a plan-view outline of the roof with zone boundaries drawn from the drainage-area structure of the roof (each zone drains to a discrete drain or drain cluster), expansion joints, level changes, and roof sections added during building additions. Zone numbering is assigned once and never changes.
Every subsequent inspection, repair record, moisture core, and IR scan result we produce for the building uses the same zone numbering. Zone 4 is Zone 4 on the zone diagram, on the photo log, on the condition table, on the moisture distribution map, and on the capital plan. That permanence is what makes the data useful across time — and what makes it useful to a new property manager or a new asset manager who inherits the file.
How We Draw and Number the Zones
Zone boundaries follow the roof's drainage structure. A roof with four internal drains and two perimeter scuppers has at least six drainage areas — each one becomes its own zone (or is subdivided further if the area is large enough that a single inspector observation loses meaningful location data). Expansion joints always create zone boundaries. Level changes (where one roof section is higher than another) always create zone boundaries. Areas added in building expansions get new zone numbers that document the construction history.
Zone numbering starts at 1 from the primary building entrance and proceeds clockwise. On multi-story buildings with multiple roof levels, we number by level first (Level 2 zones are numbered 2-01, 2-02, etc.; Level 3 zones are 3-01, 3-02, etc.) so the diagram is navigable by anyone who has not walked the roof. The total zone count on a standard Fort Worth commercial building runs from 4 to 30+ depending on building size, drainage complexity, and construction phasing.
We note the area of each zone in the diagram legend. Zone area is the input for moisture survey core-pull density calculations (cores per zone, calibrated to zone area), repair cost estimates (cost per square by zone), and the 25% wet-insulation threshold calculation (total wet area versus total roof area). Having the areas in the diagram means we never have to re-measure to answer those questions.
Photo-Keyed Documentation and Long-Term Permanence
Every photo in every report we produce is keyed to the zone diagram. Photo 14-a was taken at a location within Zone 14, and Zone 14 is a numbered polygon on the diagram. The photo key system means you can start at the condition-table entry for Zone 14's flashing deficiency, find photo 14-a in the photo log, and find Zone 14 on the diagram — in any order, in any of the three directions. That navigability is what makes a 30-page report usable rather than overwhelming.
For Fort Worth buildings that we have managed for multiple years, the zone diagram carries a notation layer that records major events by zone: hail repair in Zone 3 in 2019, insulation replacement in Zones 1 and 2 in 2021, drain relocation in Zone 7 in 2022. That event history, keyed to zones, is what allows an incoming property manager or asset manager to understand the roof's history without reading years of inspection reports from scratch. The diagram is the index to the file.
Get a permanent zone diagram for your Fort Worth commercial roof.
We will measure the roof, draw the diagram, number the zones, and deliver a document that every inspection, repair, and condition report we produce going forward will be keyed to.
Frequently Asked Questions
Do you draw the zone diagram during the inspection or before?
For first-time inspections, we draw a preliminary diagram in the office from any available building drawings or satellite reference, then refine it during the inspection walk with field measurements. The final diagram reflects the field measurements — not the satellite image, which distorts dimensions and does not show equipment that blocks roof access or creates drainage anomalies. For ongoing inspection clients, the diagram is already in the file and we update it only when the physical roof changes (addition, equipment change, drain relocation).
What format is the zone diagram delivered in?
PDF (embedded in the report) and as a separate scalable file (SVG or PDF) that can be printed at large format or imported into property management software. We can also deliver the zone diagram as a CAD-compatible file (DXF) if your asset management team uses CAD-based property documentation. The zone diagram is your document — it travels with the building file, not with the contractor.
What happens to the zone diagram if we switch contractors?
You keep it. The zone diagram belongs to you, not to us. We deliver it as part of the inspection report package and we encourage you to maintain it in your building file regardless of who does your next inspection. A good zone diagram transferred to a new contractor is more valuable than a new diagram drawn from scratch — it preserves the zone numbering history that makes trend data readable.
Can you draw zone diagrams for Fort Worth buildings you haven't inspected yet?
Yes. We can draft a zone diagram from building drawings and then refine it during a first inspection. If you need the zone diagram before we have done an inspection — for example, to set up a property management template or to prepare for an acquisition — we can work from available drawings and note that the diagram is a draft pending field verification. Draft diagrams are clearly labeled and updated to final status after the first inspection walk.